Galleon Gold Reports Assay Results from West Cache Project, Timmins, Ontario
TORONTO: November 10, 2021. Galleon Gold Corp. (TSXV: GGO) (the “Company” or “Galleon Gold”) is pleased to announce assay results from the Company’s ongoing re-evaluation of historic core at its 100% owned West Cache Gold Project, Timmins, Ontario (“West Cache” or the “Project”). This re-evaluation includes selective re-logging and assaying of previously un-sampled core from the 2009-2017 drill programs. Results from this work will provide additional data and support for the gold system currently being evaluated in support of the PEA.
Highlights:
- Hole TPW-10-15 containing 3.33 g/t over 3.7m, including 7.49 g/t over 1.5m
- Hole TPW-10-22 containing 4.87 g/t over 4.0m, including 18.60 g/t over 1.0m
- Hole TPW-12-86 containing 9.14 g/t over 1.5m
Purpose of Historic Core Re-log and New Sampling Program
Historically, core at the Project was selectively sampled and assayed where intervals exhibited obvious quartz veining, strong sulphide mineralization and alteration. During the recent 2020-2021 drill program, the Company analyzed the entire length of the hole to evaluate gold potential and geological continuity in less “visually” altered intervals. Assay results from the 46,384 meters drilled during the 2020-2021 program demonstrated that gold zones at West Cache can be visually subtle and potentially overlooked with an intermittent sampling methodology. Geological modeling undertaken as part of the updated Mineral Resource Estimate (see September 8, 2021 news release) identified un-assayed areas from historic drilling with significant gold potential by projecting known gold zones intersected in recent drilling. The ongoing re-log and sampling program evaluates these areas for better geological continuity, resulting in a more reliable resource model.
Results from ongoing Re-evaluation of Historic Drilling
Results from the ongoing re-evaluation of the historic drill core have: 1) identified new mineralized intervals, 2) extended known intervals, 3) contributed to a better understanding of the relationship between gold grades and geology, and 4) provided greater confidence in geological wireframing and resource modeling. Over 1,300 new validated assay results will be incorporated into the new modeling for the updated Mineral Resource Estimate and PEA currently underway.
Figure 1 shows a plan map indicating the location of the recently sampled holes, while Figure 2 provides a cross section with select new assay results in the East Pit area.
Figure 1 – Drill hole plan map with infill sampling results
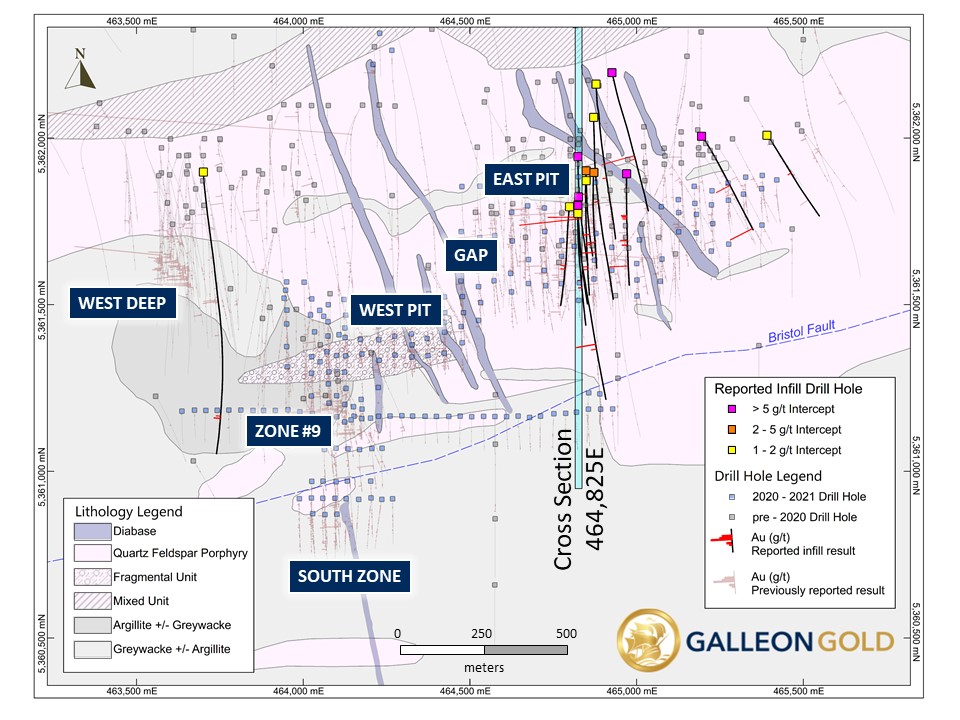
Figure 2 – Cross section 464,825E (East Pit area)
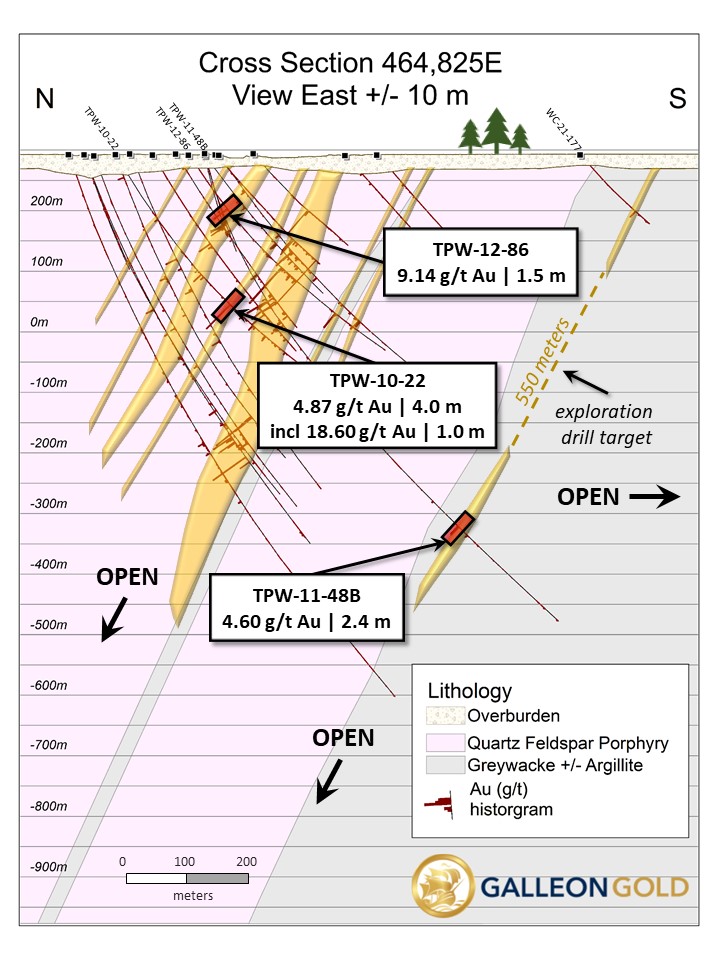
Table 1 – Gold assay results from previously unsampled core
Technical Content and Qualified Persons
The technical content has been reviewed and approved by West Cache Gold Project Manager Leah Page, P. Geo. (APGNS #217) and West Cache Gold Resource Geologist, Rochelle Collins, P. Geo (PGO #1412), both “Qualified Persons” as defined in National Instrument 43-101 - Standards of Disclosure for Mineral Projects.
Data Verification
QAQC procedures were executed to ensure all work is conducted in accordance with best practices. Core selected for infill sampling was sawn in half with one half of the core prepared for shipment and the other half retained for future verification. Commercially prepared certified reference material (“CRM”) standards, blanks and duplicates were inserted with each shipment at a rate of 1 QAQC sample in every 20 core samples. Samples from Galleon Gold’s 2021 re-log program were analyzed at AGAT Laboratories (Timmins, ON and Mississauga, ON) and Activation Laboratories (Timmins, ON) by 30-gram fire assay with atomic absorption finish. Any sample assaying greater than 10 g/t was re-assayed with gravimetric analysis. Samples uncovered from the re-log program in 2015 were analyzed at Bureau Veritas Laboratories (Timmins ON and Vancouver, BC) using a hybrid 4-acid and aqua regia digestion ICP-MS multi-element geochemical package.
About West Cache Gold Project
The West Cache Gold Project is located 13 km west of Timmins Ontario and is serviced by Provincial Highway 101 and secondary access roads. It is situated along the Porcupine – Destor Deformation Zone in the Timmins Gold Belt, approximately 7 km northeast of Pan American Silver’s Timmins West Mine and 14 km southwest of Newmont’s Hollinger Mine.
West Cache is an advanced-stage gold exploration project covering over 3,680 ha that hosts the current Mineral Resource near the center of the property. The Mineral Resource is contained within the Porcupine Sedimentary Basin, a favorable litho-structural corridor with over 2 km of strike-length on the Property. Mineralization is open in all directions and at depth.
About Galleon Gold
Galleon Gold is a North American exploration and development company. Eric Sprott holds approximately 23% of the Company’s outstanding common shares and is also the Company’s partner on the Neal Gold Project in Idaho. A Preliminary Economic Assessment is currently underway for the Company’s West Cache Gold Project.
For further information:
Galleon Gold
R. David Russell
Chairman and CEO
T. (416) 644-0066
info@galleongold.com
www.galleongold.com
Forward-Looking Statements
This document contains certain forward-looking statements that reflect the current views and/or expectations of Galleon Gold with respect to its long-term strategy, proposed work and other plans and expected timing of PEAs and other reports for its projects. Forward-looking statements are based on the then-current expectations, beliefs, assumptions, estimates and forecasts about the business and the markets in which Galleon Gold operates. Some of the statements contained herein may be forward-looking statements which involve known and unknown risks and uncertainties. Without limitation, statements regarding potential mineralization and resources, exploration results, expectations, plans, and objectives of Galleon Gold are forward-looking statements that involve various risks. The following are important factors that could cause Galleon Gold’s actual results to differ materially from those expressed or implied by such forward-looking statements: changes in the world-wide price of mineral commodities, general market conditions, risks inherent in mineral exploration, risks associated with development, construction and mining operations, risks related to infectious diseases, including Covid-19 and the uncertainty of future exploration activities and cash flows, and the uncertainty of access to additional capital. There can be no assurance that forward-looking statements will prove to be accurate as actual results and future events may differ materially from those anticipated in such statements. Galleon Gold undertakes no obligation to update such forward-looking statements if circumstances or management’s estimates or opinions should change. The reader is cautioned not to place undue reliance on such forward-looking statements.
Neither the TSX Venture Exchange nor its Regulation Services Provider (as that term is defined in policies of the TSX Venture Exchange) accepts responsibility for the adequacy or accuracy of this release.