Galleon Gold Delivers Maiden Preliminary Economic Assessment and Updated Mineral Resource Estimate for West Cache Gold Project
TORONTO: January 12, 2022. Galleon Gold Corp. (TSXV: GGO) (the “Company” or “Galleon Gold”) is pleased to announce the positive results of an independent maiden Preliminary Economic Assessment (“PEA”), including an updated Mineral Resource Estimate prepared in accordance with National Instrument 43-101 - Standards of Disclosure for Mineral Projects (“NI 43-101”) for its West Cache Gold Project (the “Project” or the “Property”), Timmins Ontario. The PEA considers an underground mine utilizing Toll Processing for treatment of mineralized material over an 11-year mine life. All amounts are shown in Canadian dollars unless otherwise stated.
PEA Highlights – West Cache Gold Project
- Pre-Tax Net Present Value at a 5% discount rate (“NPV5%”) of $378 million with Internal Rate of Return (“IRR”) of 33.7%, 3.0 years payback at US$1,700/oz gold price
- After-tax NPV5% of $240 million with IRR of 26.7% and 3.3 years payback
- 11 years Life of Mine (“LOM”) plus two years of ramp-up. Production at 2,400 tpd.
- 940,200 ounces of gold mined over LOM with average annual production of 85,500 ounces. Recovered gold is estimated at 893,200 ounces over the LOM.
- Cash cost of US$814 per ounce and all-in sustaining cost of US$987 per ounce
- Initial capex $150 million
- Alternative scenario for construction of on-site mill demonstrates positive economics (NPV5% $368 million, IRR 24.5%, payback 3.7 years on pre-tax basis)
- Project is now progressing towards bulk sample of Zone #9 and Pre-Feasibility Study, including plans for upgrading and expanding the Mineral Resource
Updated Mineral Resource Estimate Highlights (underground Mineral Resource at 1.6 g/t Au cut-off grade)
- Significant increase in the grade and total ounces in the Indicated and Inferred Mineral Resource classifications
- Indicated Mineral Resource of 472,000 ounces (4,051 kt at an average grade of 3.63 g/t Au)
- Inferred Mineral Resource of 1,088,000 ounces (11,788 kt at an average grade of 2.87 g/t Au)
Comments from the CEO
R. David Russell, President and CEO of Galleon Gold commented, “I am extremely pleased with the first economic valuation for West Cache, as the results from our PEA demonstrate that the project could support a profitable underground mining operation. The PEA incorporates the near-term option of using local toll processing, while also suggesting on-site processing becomes increasingly attractive with further growth in the project’s Mineral Resource.
Based on our geologic model, I believe West Cache has the potential to extend the LOM beyond the initial 11 years by expanding the Mineral Resource downdip and along strike. Moreover, we have explored less than 10% of the Property and recent geological interpretations suggest we should be looking to pursue new exploration targets in untested host rock both north and south of the current Mineral Resource. Our primary exploration goal for 2022 is to add high grade gold ounces and expand the Mineral Resource through surface drilling. In early to mid 2023, pending permits, we plan to commence underground test mining the high-grade Zone #9 area.”
PEA Financial Results Summary
The economic analysis was performed assuming a 5% discount rate. A summary of project economics is listed in Table 1. On a pre-tax basis the NPV5% is estimated at $378 million, IRR is 33.7 % and the payback is 3.0 years. On an after-tax basis the NPV5% is estimated at $240 million, IRR is 26.7 % and the payback is 3.3 years.
Table 1: Summary of PEA Financial Results
(All costs in Canadian dollars unless otherwise noted)
| General | ||
| Gold Price (US$/oz) | 1,700 | |
| Exchange Rate (US$:C$) | 0.76 | |
| LOM (years) | 11 | |
| Production | ||
| Total Gold Mine Production (oz) | 940,200 | |
| Average Annual Production (oz) | 85,470 | |
| Total Mill Ounces Recovered (oz) | 893,200 | |
| Operating Costs | ||
| Mining Cost ($/t Mined) | 64.40 | |
| Processing Cost ($/t Processed) | 28.00 | |
| G&A Cost ($/t Processed) | 4.51 | |
| Total Operating Costs ($/t Processed) | 96.92 | |
| Royalty NSR after 1 % buyback (%) | 2 | |
| Cash Costs (US$/oz Au) | 814 | |
| AISC (US$/oz Au) | 987 | |
| Capital Costs | ||
| Initial Capital ($M) | 150 | |
| Sustaining Capital ($M) | 199 | |
| Closure Costs ($M) | 5 | |
| Financials | Pre-Tax | After-Tax |
| NPV (5%) ($M) | 378 | 240 |
| IRR (%) | 33.7 | 26.7 |
| Payback (years) | 3.0 | 3.3 |
The PEA was prepared in accordance with National Instrument 43-101 (“NI 43-101”) by P&E Mining Consultants Inc. of Brampton, Ontario, Canada with an effective date of January 10, 2022. The Company will file the PEA on SEDAR at www.sedar.com in accordance with NI 43-101 within 45 days of this news release.
Cautionary Statement – The reader is advised that the PEA summarized in this news release is intended to provide only an initial, high-level review of the project potential and design options. The PEA mine plan and economic model include numerous assumptions and the use of Inferred Mineral Resources. Inferred Mineral Resources are considered to be too speculative to be used in an economic analysis except as allowed by NI 43-101 in PEA studies. There is no guarantee the project economics described herein will be achieved.
Gold Price Sensitivities
Table 2 outlines the sensitivities of the NPV and IRR to gold price per ounce using an exchange rate of 0.76 (US$/C$).
Table 2: Economic Sensitivity to Gold Prices
| Pre-Tax | After-Tax | |||
| Price (US$/oz) |
NPV5% (C$ million) |
IRR (%) |
NPV5% (C$ million) |
IRR (%) |
| 1,500 | 224.5 | 23.3 | 128.6 | 17.2 |
| 1,600 | 301.4 | 28.6 | 184.3 | 22.0 |
| 1,700 | 378.3 | 33.7 | 240.1 | 26.7 |
| 1,800 | 455.5 | 38.7 | 291.8 | 30.8 |
| 1,900 | 532.6 | 43.6 | 343.6 | 34.8 |
| 2,000 | 609.8 | 48.4 | 395.3 | 38.7 |
Mine Design and Production Schedule
Mineralization has been planned to be extracted from 20 geological domains, over an area of 2.1 km x 1.2 km. The Deposit extends at depth over 1.0 km from surface, with extraction targets covering the entire vertical extent. Due to the large extents of the Mineral Resource, it has been divided into four mining areas (Mines A-D) with separate portals. Each mining area is further sub-divided into mining “Blocks” to increase available working faces and limit development requirements prior to commencement of production. Ramps developed from each portal will provide access to the Deposit. Extraction of mineralized material will use the longhole retreat stoping method with cemented hydraulic backfill. Sublevels have been planned at 30 m high intervals. Mining equipment will consist of 30 tonne trucks with 7 and 10 tonne load-haul-dump units.
Production has been scheduled at 2,400 tpd which is equivalent to 880,000 tpa.
Figure 1 and 2 show the West Cache project in plan view and longitudinal projection respectively, while Figure 3 shows 3D views of the four mining areas and grades. Table 3 outlines LOM production.
Figure 1: Mine Development Plan - Plan View
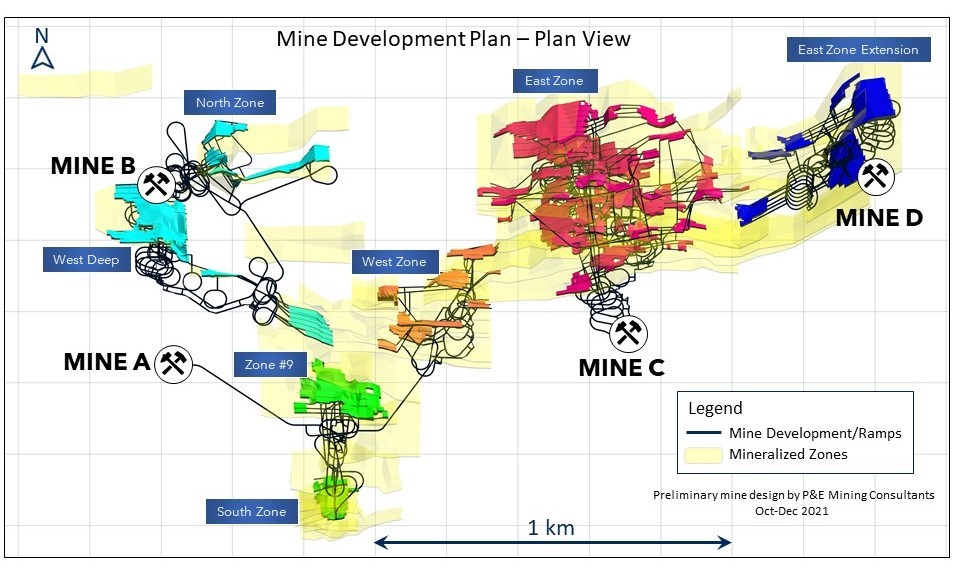
Figure 2: 3D Longitudinal Projection of West Cache Project 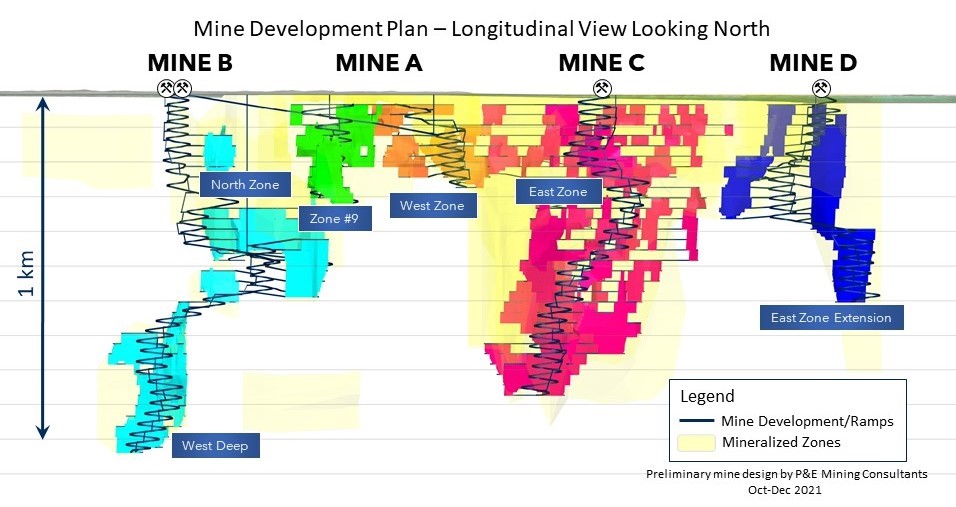
Figure 3: 3D Views of the Four West Cache Project Mining Areas

Table 3: Production Summary
| Description | LOM Total |
| Mineralized Material Mined (tonnes) | 9,459,000 |
| Grade (g/t Au) | 3.09 |
| Contained Gold (ozs) | 940,200 |
| Recovered Gold (ozs) | 893,200 |
Operating Costs
Mining and development will be performed entirely by Company personnel, with an owned equipment fleet. Mining equipment will be leased over five-year terms. Processing will be performed at an offsite toll process plant in the Timmins area, with tailings backhauled from the process plant to the West Cache site for use as backfill. A contractor will be engaged to transport mineralized material to the toll process plant and backhaul tailings. Table 4 provides a summary of the estimated operating costs.
Table 4: Operating Cost Summary
| Operating Cost Item | LOM Cost ($M) |
Cost ($/t processed) |
| Mining | 609.2 | 64.40 |
| Processing | 264.8 | 28.00 |
| G&A | 42.7 | 4.51 |
| TOTAL | 916.7 | 96.92 |
Capital Costs
Initial capital costs are estimated at $150 million and are relatively low for a project of this size since they do not include construction of a process plant or a tailings storage facility. The majority of initial capital costs will be for underground mine development since the Mineral Resource extends over a large area. Infrastructure costs are minimal due to the close proximity of the site to Timmins, Highway 101 and an existing powerline. Sustaining capital is estimated at $199 million over the LOM and is primarily for mine development. Capital costs are summarized in Table 5.
Table 5: Capital Cost Summary
| Capital Cost Item | Initial ($M) | Sustaining ($M) | Total ($M) |
| Mining and mine development | 111.7 | 171.5 | 283.2 |
| Laboratory | 0.5 | - | 0.5 |
| Site Infrastructure | 7.7 | - | 7.7 |
| Backfill System | 13.7 | 1.3 | 15.0 |
| Contingencies @ 15% | 16.0 | 25.9 | 41.9 |
| TOTAL PROJECT | 149.6 | 198.6 | 348.2 |
| CLOSURE COSTS | 5.0 |
Updated Mineral Resource Estimate
The Mineral Resource Estimate was based on the results of 557 holes and 210,000 metres of drilling including 213 holes for 46,380 metres of surface diamond drilling completed since the Company acquired the project. Geological modeling undertaken as part of a Mineral Resource Estimate announced last year (see September 8, 2021 news release) identified un-assayed areas from historic drilling with significant gold potential by projecting known gold zones intersected in the 2020-2021 drill program. The Company undertook a re-log and sampling program as well as verified assay data from third party drilling in 2015-2016. These recent results identified additional areas of better geological continuity and were used to re-build the Mineral Resource model wire-framing and mine plan from a combined open pit/underground approach to the all-underground design plan used in the current PEA.
The Mineral Resource Estimate for the West Cache Project, with an effective date of January 10, 2022, is summarized in Table 6, while Table 7 provides select cut-off grade sensitivities.
Table 6: West Cache Mineral Resource Estimate (1-5)
| Underground Mineral Resource @ 1.6 g/t Au Cut-Off | |||
| Classification | Tonnes k |
Au g/t |
Au k oz |
| Indicated | 4,051 | 3.63 | 472 |
| Inferred | 11,788 | 2.87 | 1,088 |
- Mineral Resources that are not Mineral Reserves do not have demonstrated economic viability.
- The estimate of Mineral Resources may be materially affected by environmental, permitting, legal, title, taxation, socio-political, marketing, or other relevant issues.
- The Inferred Mineral Resource in this estimate has a lower level of confidence than that applied to an Indicated Mineral Resource and must not be converted to a Mineral Reserve. It is reasonably expected that the majority of the Inferred Mineral Resource could potentially be upgraded to an Indicated Mineral Resource with continued exploration.
- The Mineral Resources were estimated in accordance with the Canadian Institute of Mining, Metallurgy and Petroleum (CIM), CIM Standards on Mineral Resources and Reserves, Definitions (2014) and Best Practices Guidelines (2019) prepared by the CIM Standing Committee on Reserve Definitions and adopted by the CIM Council.
- The Au cut-off parameters used were US$1,650/oz Au, 0.76 FX with a process recovery of 95% Au, mining cost of C$85/tonne, C$16/tonne process cost and C$4/tonne G&A. Mineral Resources selected exhibited continuity and reasonable potential for extraction by the long hole underground mining method.
Table 7: Select Au Cut-Off Grade Mineral Resource Sensitivities
| Classification | Cut-off Au g/t |
Tonnes k |
Au g/t |
Au k oz |
| Indicated | 5.0 | 753 | 7.79 | 189 |
| 3.0 | 1,750 | 5.54 | 311 | |
| 2.5 | 2,287 | 4.88 | 359 | |
| 2.0 | 3,142 | 4.16 | 420 | |
| 1.6 | 4,051 | 3.63 | 472 | |
| 1.25 | 5,288 | 3.11 | 528 | |
| 1.0 | 6,564 | 2.72 | 574 | |
| 0.5 | 10,591 | 1.96 | 668 | |
| Inferred | 5.0 | 759 | 6.96 | 170 |
| 3.0 | 3,492 | 4.49 | 504 | |
| 2.5 | 5,629 | 3.81 | 690 | |
| 2.0 | 8,707 | 3.25 | 911 | |
| 1.6 | 11,788 | 2.87 | 1,088 | |
| 1.25 | 15,649 | 2.51 | 1,265 | |
| 1.0 | 19,681 | 2.23 | 1,410 | |
| 0.5 | 30,286 | 1.71 | 1,661 |
Next Steps
The results for the PEA, using the base case assumptions, indicate that the West Cache Project has both technical and financial merit. The project’s next steps include:
- Infill drilling to increase near-mine Mineral Resources and convert Inferred Mineral Resources to the Indicated classification
- Additional drilling along strike and dip to extend mineralization as well as identify new high-grade shoots
- Deeper exploration drilling to test plunge and area between Zone #9 and West Deep
- Step-out drilling to test regional targets outside of the known Mineral Resource area– only 10% of the project area has been drill tested
- Continue baseline and permitting studies in support of bulk sample application
- Commence planning and studies for initial ramp engineering for bulk sample
Webcast Details
The Company will host a webcast and conference call to review the PEA and future plans on January 13, 2020 at 11:00 am ET. A replay of the webcast will be available on the Company’s website.
Conference Call Number:
Toll Free Canada/USA: 1-800-319-4610
Toronto Toll: 1-416-915-3239
Webcast Link:
https://www.gowebcasting.com/11698
Technical Content and Qualified Persons
The PEA and Mineral Resource Estimate for West Cache included in the press release were prepared under the supervision of Eugene Puritch, P.Eng., FEC, CET, President of P&E Mining Consultants Inc., an Independent Qualified Person as defined by NI 43-101. The geological technical content has also been reviewed and approved by West Cache Gold Project Manager Leah Page, P. Geo. (APGNS #217) and West Cache Gold Resource Geologist, Rochelle Collins, P. Geo (PGO #1412), both “Qualified Persons” as defined in National Instrument 43-101 - Standards of Disclosure for Mineral Projects.
A Technical Report to support the PEA and updated Mineral Resource Estimate for the West Cache Project, prepared in accordance with NI 43-101, will be filed on SEDAR (www.sedar.com) within 45 days of this news release.
About West Cache Gold Project
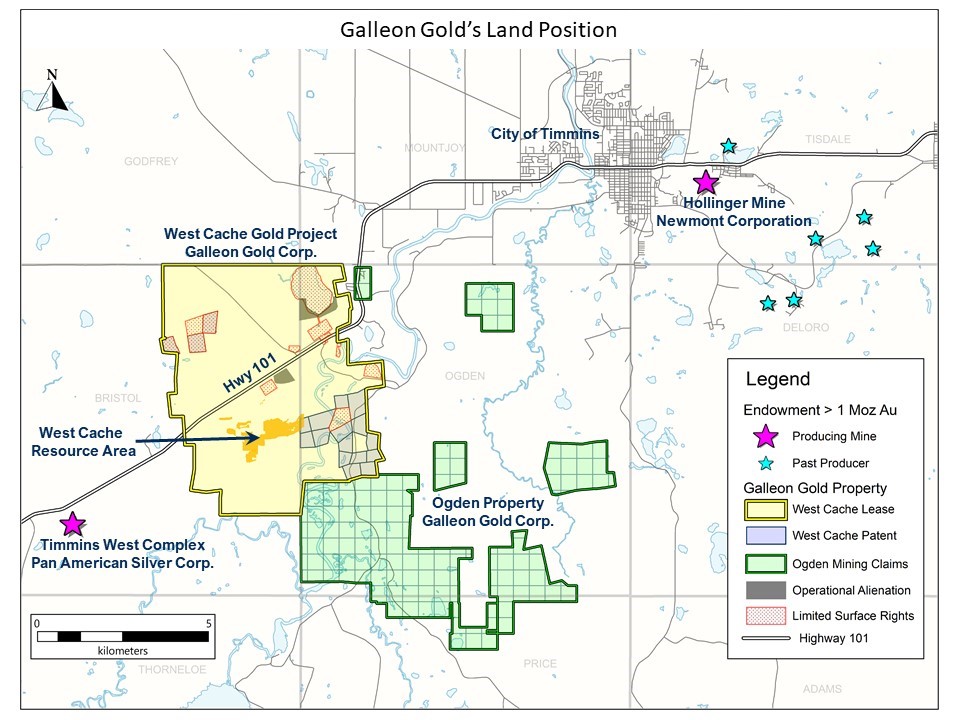
The West Cache Gold Project is located 13 km west of Timmins Ontario and is serviced by Provincial Highway 101 and secondary access roads. It is situated along the Porcupine – Destor Deformation Zone in the Timmins Gold Belt, approximately 7 km northeast of Pan American Silver’s Timmins West Mine and 14 km southwest of Newmont’s Hollinger Mine. Figure 4 depicts the Projects location in relation to Timmins.
West Cache is an advanced-stage gold exploration project covering over 3,600 ha that hosts the current Mineral Resource near the center of the Property, with additional Exploration Targets to the north and south. The Mineral Resource is contained within the Porcupine Sedimentary Basin, a favourable litho-structural corridor with over 5 km of strike-length on the Property. Mineralization is open in all directions and at depth.
Figure 4: West Cache Project Location and Land Tenure
About Galleon Gold
Galleon Gold is a North American exploration and development company. Eric Sprott holds approximately 23% of the Company’s outstanding common shares and is also the Company’s partner on the Neal Gold Project in Idaho. The Company announced a positive Preliminary Economic Assessment in early 2022 for its flagship project, the West Cache Gold Project, located 13 km from Timmins, Ontario.
Non-IFRS Financial Performance Measures
This press release includes certain terms or performance measures commonly used in the mining industry that are not defined under International Financial Reporting Standards (“IFRS”), including cash costs and All-in Sustaining Costs (“AISC”) per Ounce of gold. Non-GAAP measures do not have any standardized meaning prescribed under IFRS and, therefore, they may not be comparable to similar measures employed by other companies. The Company believes that, in addition to conventional measures prepared in accordance with IFRS, certain investors use this information to evaluate performance. The data presented is intended to provide additional information and should not be considered in isolation or as a substitute for measures of performance prepared in accordance with IFRS.
Forward-Looking Statements:
This news release contains “forward-looking information” within the meaning of applicable Canadian securities legislation. All statements, other than statements of historical facts, are forward-looking information and statements. Forward-looking information includes, but is not limited to, disclosure regarding the economics and project parameters presented in the PEA, including, without limitation, NPV, IRR, initial and sustaining capital costs, operating costs, LOM production of West Cache and other costs and economic information, possible events, conditions or financial performance that is based on assumptions about future economic conditions and courses of action; the timing and costs of future development and exploration activities on the Company’s project; success of development and exploration activities; permitting time lines and requirements; time lines for further studies; planned exploration and development of the West Cache Project and the results thereof; and planned expenditures and budgets and the execution thereof. Generally, forward-looking information can be identified by the use of words such as “believes”, “plans”, “expects”, or “does not expect”, “is expected”, “budget”, “scheduled”, “estimates”, “forecasts”, “intends”, “anticipates”, or “does not anticipate”, or “believes” or variations of such words and phrases or state that certain actions, events or results “may”, “could”, “would”, “might”, or “will be taken”, “occur”, or “be achieved”. Forward-looking information is based on the opinions and estimates of management at the date the information is made, and is based on a number of assumptions and is subject to known and unknown risks, uncertainties and other factors that may cause the actual results, level of activity, performance or achievements of Galleon Gold to be materially different from those expressed or implied by such forward-looking information, including the risks outlined in this news release, risks associated with the exploration, development and mining such as economic factors as they effect exploration, future commodity prices, changes in foreign exchange and interest rates, actual results of current development and exploration activities, government regulation, political or economic developments, environmental risks, permitting timelines, capital expenditures, operating or technical difficulties in connection with development activities, employee relations, the speculative nature of gold exploration and development, including the risks of diminishing quantities of grades of Mineral Resources, contests over title to properties, and changes in project parameters as plans continue to be refined. Although Galleon Gold believes the expectations expressed in these forward-looking statements are based on reasonable assumptions, such statements should not be in any way be construed as guarantees that the West Cache Project will secure all required government permits, establish the commercial feasibility of the West Cache Project, achieve the required financing or develop the West Cache Project. Although the Company has attempted to identify important factors that could cause actual results to differ materially from those contained in forward-looking information, there may be other factors that cause results not to be as anticipated, estimated or intended. There can be no assurance that such information will prove to be accurate, as actual results and future events could differ materially from those anticipated in such information. Accordingly, readers should not place undue reliance on forward-looking information. The Company does not undertake to update any forward-looking information, except in accordance with applicable securities laws.
Neither the TSX Venture Exchange nor its Regulation Services Provider (as that term is defined in policies of the TSX Venture Exchange) accepts responsibility for the adequacy or accuracy of this release.
For further information:
Galleon Gold Corp.
R. David Russell
Chairman and CEO
T. (416) 644-0066
info@galleongold.com
www.galleongold.com